DHS survey-based datasets
If you have any questions about the satellite imagery, please reach out to Christopher Yeh (cyeh@caltech.edu). If you have any questions about the street-level imagery, please reach out to Jihyeon Lee (jihyeon@cs.stanford.edu). If you have any questions about the DHS labels, please reach out to Anne Driscoll (annedriscoll@cmu.edu).
Despite decades of progress, as of 2020 an estimated 9.5% of the global population remains in extreme poverty, 3.8% of children die before age 5 (as of 2019), 47% of children do not complete secondary school (as of 2019), 25.7% of people lack safely managed drinking water, and 46% of people lack safely managed sanitation [1]. While such statistics are generally accurate at the global level, significantly less data is available at local or even country levels. In most African countries, for example, nationally representative consumption or asset wealth surveys, the key source of internationally comparable poverty measurements, are only available once every four years or less [2]. In contrast, satellite and street-level imagery are becoming increasingly available, and previous works [2,3] have shown that such imagery can be predictive of SDG-relevant local-level statistics.

Details
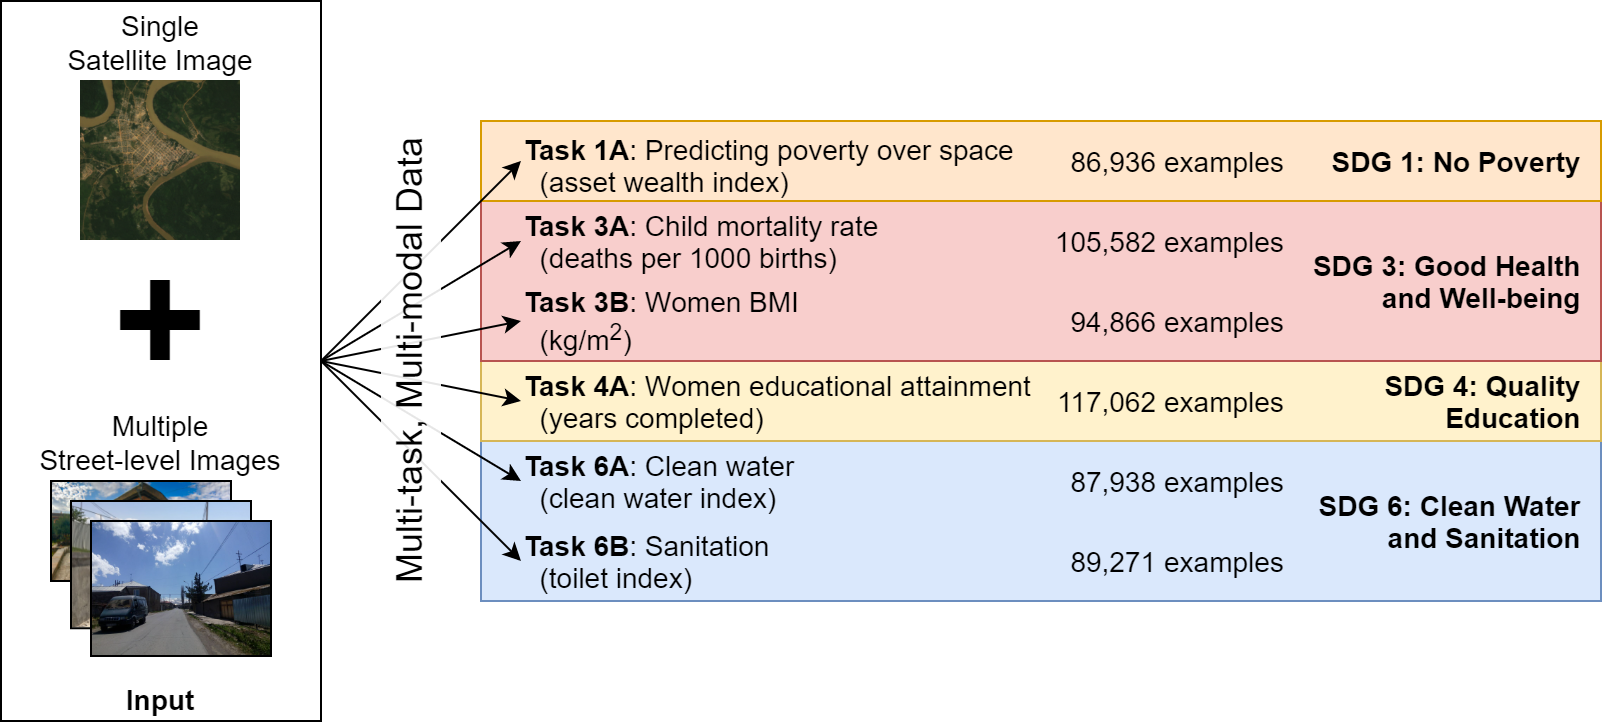
SustainBench includes 6 regression tasks derived from survey data from the Demographic and Health Surveys (DHS) program. These surveys constitute nationally representative household-level data on assets, housing conditions, and education levels, among other attributes. While the surveys provide household-level data, we summarize the survey data into “cluster-level” labels, where a “cluster” (a.k.a. “enumeration area”) roughly corresponds to a village or local community.
The labels for each of the 6 tasks are as follows:
- SDG 1: No Poverty
- asset wealth index: We use a principal components analysis (PCA)-based approach to calculate a scalar asset wealth index per household, and we then take the cluster-level average. We refer to cluster-level wealth (or its absence) as “poverty”. The asset wealth index is constructed in a similar manner to [2].
- SDG 3: Good Health and Well-being
- women BMI: The women BMI includes all women between the ages of 15 and 49, excluding pregnant women as the BMI is not adjusted for them. We take the cluster level mean of reported BMI/100.
- child mortality rate: The child mortality rate covers children who were age 5 or younger at the time of survey or who had died (age 5 or younger) no earlier than the year prior to the survey. After identifying the qualifying children, we calculate the number of deaths per 1,000 children by cluster.
- SDG 4: Quality Education
- women educational attainment: The women’s education metric is created by taking the cluster level mean of “education in single years” among women between the ages of 15 and 49. We capped the years of education at 18, a common threshold in many surveys which helps avoid outliers.
- SDG 6: Clean Water and Sanitation
- water quality index: For each household, water quality is ranked on a 1-5 scale, where 5 is the “highest quality”. The water quality index is the cluster-level average score.
- sanitation index: For each household, toilet quality is ranked on a 1-5 scale, where 5 is the “highest quality”. The sanitation index is the cluster-level average score.
Water quality and toilet quality are converted to the 1-5 scale from the raw DHS survey values using the recoding tables linked here.
| # countries | # observations | # clusters (= labels) | |
|---|---|---|---|
| asset wealth index | 48 | 2,079,036 households | 86,936 |
| women BMI | 53 | 1,781,403 women | 94,866 |
| child mortality rate | 56 | 1,936,904 children | 105,582 |
| women educational attainment | 56 | 2,910,286 women | 117,062 |
| water quality index | 49 | 2,105,026 households | 87,938 |
| sanitation index | 49 | 2,143,329 households | 89,271 |
SustainBench provides both satellite and street-level imagery as model inputs.
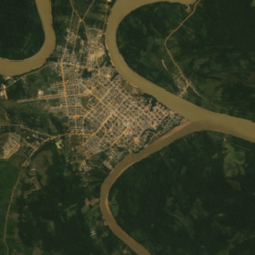
- satellite imagery: The satellite imagery consists of both daytime images from the Landsat 5/7/8 satellites and nightlights images from the DMSP and VIIRS satellites. While the daytime image bands have a native 30m/pixel resolution, the nightlights images have a lower native resolution and are upsampled using the nearest-neighbors algorithm to match the daytime image resolution. For clusters from surveys taken in 2011 or earlier, the nightlights image comes from DMSP; for clusters from surveys taken in 2012 or later, the nightlights image comes from VIIRS. Because DMSP and VIIRS imagery are not directly comparable, we recommend users to treat DMSP and VIIRS imagery separately in their models.
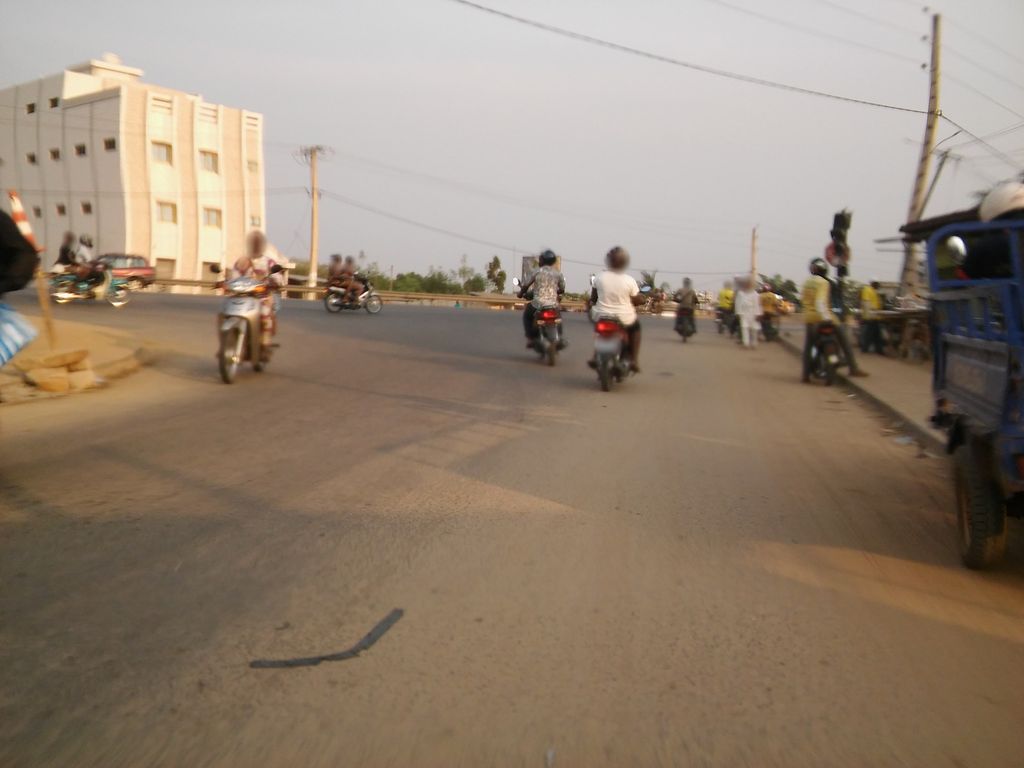
- street-level imagery: Mapillary images that fall within 0.1 degrees latitude and longitude of a DHS cluster and were captured within 3 years before or after a DHS cluster datapoint were retrieved and matched to their respective cluster. The shortest side of all images is 1024 pixels. We also provide metadata for each image, including its unique Mapillary ID, latitude, longitude, and timestamp of capture in miliseconds. Mapillary processes images with privacy blurring, blurring faces and license plates. We obtained Mapillary images for 22,052 DHS clusters (18.7%) spanning 48 countries. Of these clusters with Mapillary images, the number of images per cluster ranges from 1 to a maximum of 300, with a mean of 76.3 and median of 94.0. A total of 1,682,613 Mapillary images are included. The data preprocessing pipeline can be found here.


For all of the tasks based on DHS survey data, we use a uniform train/validation/test dataset split by country. Delineating by country ensures that there is no overlap between any of the splits–i.e., a model trained on our train split will not have “seen” any part of any image from the test split. The splits are listed in the following table:
| Train | Validation | Test | |
|---|---|---|---|
| DHS Country Codes | 30 countries:AL, BD, CD, CM, GH, GU, HN, IA, ID, JO, KE, KM, LB, LS, MA, MB, MD, MM, MW, MZ, NG, NI, PE, PH, SN, TG, TJ, UG, ZM, ZW | 13 countries:BF, BJ, BO, CO, DR, GA, GN, GY, HT, NM, SL, TD, TZ | 13 countries:AM, AO, BU, CI, EG, ET, KH, KY, ML, NP, PK, RW, SZ |
| asset wealth index | 59,617 examples (69%) | 16,776 examples (19%) | 10,543 examples (12%) |
| child mortality rate | 69,052 (65%) | 17,062 (16%) | 19,468 (18%) |
| women BMI | 61,950 (65%) | 15,675 (17%) | 17,241 (18%) |
| women education | 75,818 (65%) | 20,589 (18%) | 20,655 (18%) |
| water index | 59,620 (68%) | 17,773 (20%) | 10,545 (12%) |
| sanitation index | 60,184 (67%) | 16,776 (19%) | 12,311 (14%) |
We evaluate model performance using the squared Pearson correlation coefficient (\(r^2\)) on predictions and labels in held-out cluster locations.
Data Format
Input
The input is multi-modal, consisting of a single 255x255x8px satellite image as well as a set of between 0 and 300 street-level RGB images whose shortest length is 1024px. The first 7 bands of the satellite image are surface reflectance values from the Landsat 5/7/8 satellites and have the following order: blue, green, red, shortwave infrared 1, shortwave infrared 2, thermal, and near infrared. The last band in the satellite image is the nightlights band, from either the DMSP or VIIRS satellite.
We provide metadata associated with the labels, including the (lat, lon) geocoordinates and country of the cluster, year of the survey, a binary urban/rural indicator, and number of observations within the cluster. Note that the geocoordinates may not be exact, as they may have been “jittered” randomly up to 2km for urban clusters and 10km for rural clusters to protect survey participant privacy.
We also provide metadata associated with each street-level image, including a unique ID, timestamp of capture in milliseconds, year of capture, latitude, and longitude.
Output
The model output has between 1 to 6 values, depending on which of the 6 regression tasks are selected.
Dataloader Configuration
Use the dhs_dataset in the SustainBench dataloader.
Baseline Model
For the baseline models using Mapillary street-level imagery to predict poverty, population, and women’s BMI, documentation can be found here.
Download
The data can be downloaded from Google Drive here.
References
[1] United Nations Department of Economic and Social Affairs. The Sustainable Development Goals Report 2021. The Sustainable Development Goals Report. United Nations, 2021 edition, 2021. ISBN 978-92-1-005608-3. doi: 10.18356/9789210056083. URL https://www.un-ilibrary.org/content/books/9789210056083.
[2] C. Yeh, A. Perez, A. Driscoll, G. Azzari, Z. Tang, D. Lobell, S. Ermon, and M. Burke. Using publicly available satellite imagery and deep learning to understand economic well-being in Africa. Nature Communications, 11(1), 5 2020. ISSN 2041-1723. doi: 10.1038/s41467-020-58916185-w. URL https://www.nature.com/articles/s41467-020-16185-w.
[3] J. Lee, D. Grosz, B. Uzkent, S. Zeng, M. Burke, D. Lobell, and S. Ermon. Predicting Livelihood Indicators from Community-Generated Street-Level Imagery. Proceedings of the AAAI Conference on Artificial Intelligence, 35(1):268–276, 5 2021. ISSN 2374-3468. URL https://ojs.aaai.org/index.php/AAAI/article/view/16101.