Weakly Supervised Cropland Segmentation
If you have any questions about this dataset, please reach out to Sherrie Wang (sherwang@berkeley.edu).
One indicator for SDG 2 is the proportion of agricultural area under productive and sustainable agriculture. Existing state-of-the-art datasets on land cover are derived from satellite time series and include a cropland class. However, the maps are known to have large errors in regions of the world like Sub-Saharan Africa where ground labels are sparse [1]. Therefore, while mapping cropland is largely a solved problem in settings with ample labels, devising methods to efficiently generate georeferenced labels and accurately map cropland in low-resource regions remains an important and challenging research direction.

Dataset Overview
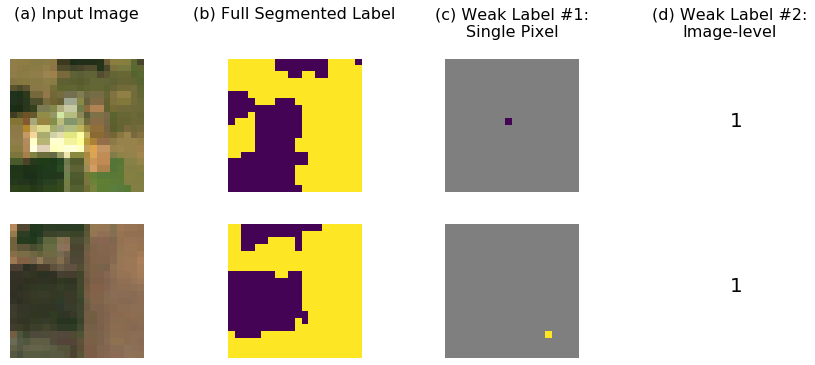
We release a dataset for performing weakly supervised classification of cropland in the United States using data from [2], which has not been released previously. While densely segmented labels are time-consuming and infeasible to generate for a region as large as Sub-Saharan Africa, pixel-level and image-level labels are often already available and easier to create.
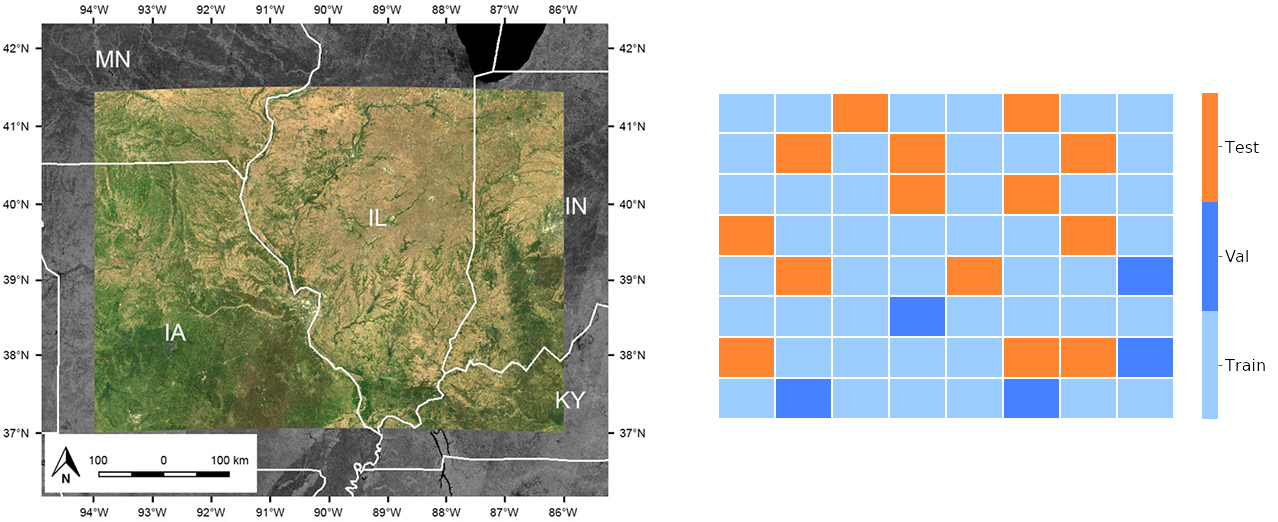
The study area spans from 37°N to 41°30’N and from 94°W to 86°W, and covers an area of over 450,000 square kilometers in the Midwestern United States. We chose this region because the US Department of Agriculture (USDA) maintains high-quality pixel-level land cover labels across the US [3], allowing us to evaluate the performance of algorithms. Land cover-wise, the study region is 44% cropland and 56% non-crop (mostly temperate forest).

Input
The inputs are tiles of imagery taken by the Landsat-8 satellite and composited over 2017. Landsat 8 provides moderate-resolution (30m) satellite imagery in seven surface reflectance bands (ultra blue, blue, green, red, near infrared, shortwave infrared 1, shortwave infrared 2) designed to serve a wide range of scientific applications. Images are collected on a 16-day cycle. We computed a single composite by taking the median value at each pixel and band from January 1, 2017 to December 31, 2017. We used the quality assessment band delivered with the Landsat 8 images to mask out clouds and shadows prior to computing the median composite. The resulting seven-band image spans 4.5 degrees latitude and 8.0 degrees longitude and contains just over 500 million pixels.
Output
The ground truth labels from the Cropland Data Layer [3] are at the same spatial resolution as Landsat, so that for every Landsat pixel there is a corresponding {cropland, not cropland} label. For each image, we generate two types of weak labels: (1) single pixel and (2) image-level, both with the goal of generating dense semantic segmentation predictions. The image-level label is either “at least half cropland” or “less than half cropland”.
Training, validation, and test set splits
We offer the user a fixed geographic split of train, validation, and test sets. We provide a set of 50x50 tiles in each split as well as the entire GeoTIFFs of Landsat imagery so that users can devise their own weakly supervised, semi-supervised, or active learning algorithm. The final evaluation is segmentation performance on the test set tiles.
Dataloader Configuration
To load the Weakly Supervised Cropland dataset, use weak_cropland in the SustainBench dataloader.
Download
The data can be downloaded here.
Citation
Please cite Wang et al. (2020) for the baseline model.
@article{wang2020weakly,
  Author = {Wang, Sherrie and Chen, William and Xie, Sang Michael and Azzari, George and Lobell, David B.},
  Journal = {Remote Sensing},
  Number = {2},
  Title = {Weakly Supervised Deep Learning for Segmentation of Remote Sensing Imagery},
  Volume = {12},
  Year = {2020}}
References
[1] H. Kerner, G. Tseng, I. Becker-Reshef, C. Nakalembe, B. Barker, B. Munshell, M. Paliyam, and M. Hosseini. Rapid response crop maps in data sparse regions, 2020.
[2] S. Wang, W. Chen, S. M. Xie, G. Azzari, and D. B. Lobell. Weakly supervised deep learning for segmentation of remote sensing imagery. Remote Sensing, 12(2), 2020.
[3] National Agricultural Statistics Service. USDA National Agricultural Statistics Service Cropland Data Layer. Published crop-specific data layer [Online], 2018. URL https://nassgeodata.594gmu.edu/CropScape/.