Crop Yield Prediction
Accurate measurement of crop yields is crucial to tracking progress in farmland productivity. However, in most areas of the world, accurate local estimates of crop yield are extremely rare; most yield estimates are aggregated over broad geographic regions.
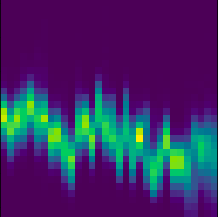
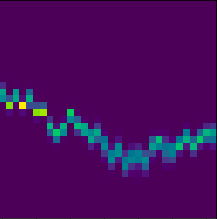
Example Histograms


Details
Our dataset is based on the datasets used in [1] and [2]. We release county-level yields for 857 counties in the United States, 135 in Argentina, and 32 in Brazil for the years 2005-2016, with a total of 9049 datapoints in the United States, 1615 in Argentina, and 384 in Brazil. The inputs are spectral band and temperature histograms over each county for the harvest season, derived from MODIS satellite images of each region. The outputs are soybean yields in metric tonnes per harvested hectare over the counties. As in [1], we create a 60-20-20 train-validation-test split for each of the three countries.
Data Format
Input
The input is a 32x32x9 band histogram over a county’s harvest season. For each of 7 surface reflectance and 2 surface temperature bands, we bin MODIS pixel values into 32 ranges and 32 timesteps per harvest season.
Output
The output is the soybean yield over the harvest season, in metric tonnes per harvested hectare.
Dataloader Configuration
To load the Crop Yield Prediction dataset, use crop_yield_dataset in the SustainBench dataloader.
- Use
split_scheme='usa'orsplit_scheme='official'in the configuration to load the United States dataset. - Use
split_scheme='argentina'to load the Argentina dataset. - Use
split_scheme='brazil'to load the Brazil dataset.
Benchmark Details
Given an input histogram, the goal is a regression to output the corresponding soybean yield. As in [1], we evaluate models using the root mean squared error (RMSE) and \(R^2\) metrics.
Download
The data can be downloaded here.
Citation
@inproceedings{wang2018transfer,
    author = {Wang, Anna X. and Tran, Caelin and Desai, Nikhil and Lobell, David and Ermon, Stefano},
    title = {Deep Transfer Learning for Crop Yield Prediction with Remote Sensing Data},
    year = {2018},
    isbn = {9781450358163},
    publisher = {Association for Computing Machinery},
    address = {New York, NY, USA},
    url = {https://doi.org/10.1145/3209811.3212707},
    doi = {10.1145/3209811.3212707},
    booktitle = {Proceedings of the 1st ACM SIGCAS Conference on Computing and Sustainable Societies},
    articleno = {50},
    numpages = {5},
    series = {COMPASS '18}
}

@article{you2017deep,
    author = {Jiaxuan You and Xiaocheng Li and Melvin Low and David Lobell and Stefano Ermon},
    title = {Deep Gaussian Process for Crop Yield Prediction Based on Remote Sensing Data},
    conference = {AAAI Conference on Artificial Intelligence},
    year = {2017},
    keywords = {Deep learning, Crop yield prediction, Remote sensing},
    url = {https://aaai.org/ocs/index.php/AAAI/AAAI17/paper/view/14435}
}
References
[1] A. X. Wang, C. Tran, N. Desai, D. Lobell, and S. Ermon. Deep transfer learning for crop yield prediction with remote sensing data. In Proceedings of the 1st ACM SIGCAS Conference on Computing and Sustainable Societies, COMPASS ’18, New York, NY, USA, 2018. Association for Computing Machinery. ISBN 9781450358163. doi: 10.1145/3209811.3212707. URL https://doi.org/10.1145/3209811.3212707.
[2] J. You, X. Li, M. Low, D. Lobell, and S. Ermon. Deep Gaussian Process for Crop Yield Prediction Based on Remote Sensing Data. In Proceedings of the Thirty-First AAAI Conference on Artificial Intelligence, AAAI’17, page 4559-4565. AAAI Press, 2017. URL https://aaai.org/ocs/index.php/AAAI/592AAAI17/paper/view/14435.