Change in poverty over time
If you have any questions about this dataset, please reach out to Christopher Yeh (cyeh@caltech.edu).
Despite decades of progress, as of 2020 an estimated 9.5% of the global population remains in extreme poverty [1]. While such statistics are generally accurate at the global level, significantly less data is available at local or even country levels. In most African countries, for example, nationally representative consumption or asset wealth surveys, the key source of internationally comparable poverty measurements, are only available once every four years or less [2]. In contrast, satellite and street-level imagery are becoming increasingly available, and previous works [2,3] have shown that such imagery can be predictive of SDG-relevant local-level statistics.


Details
The SustainBench dataset for predicting change in poverty over time is based on the similar dataset described in [1]. This dataset uses survey data from the World Bank’s Living Standards Measurement Study (LSMS) program. These surveys constitute nationally representative household-level data on assets, among other attributes. While the surveys provide household-level data, we summarize the survey data into “cluster-level” labels, where a “cluster” (a.k.a. “enumeration area”) roughly corresponds to a village or local community. Notably, LSMS data form a panel—i.e., the same households are surveyed over time, facilitating comparison over time.
Based on the panel survey data, we calculate two PCA-based measures of change in asset wealth over time for each household: diffOfIndex and indexOfDiff. For diffOfIndex, we first assign each household-year an asset index computed as the first principal component of all the asset variables; this is the same approach used for the DHS asset index. Then, for each household, we calculate the difference in the asset index across years, which yields a “change in asset index” (hence the name diffOfIndex). In contrast, indexOfDiff is created by first calculating the difference in asset variables in households across pairs of surveys for each country and then computing the first principal component of these differences; for each household, this yields a “index of change in assets” across years (hence the name indexOfDiff). These measures are then averaged to the cluster-level to create cluster-level labels. We excluded a cluster if it contained fewer than 3 surveyed households.
We evaluate model performance using the squared Pearson correlation coefficient (\(r^2\)) on predictions and labels in held-out cluster locations.
Data Format
Input
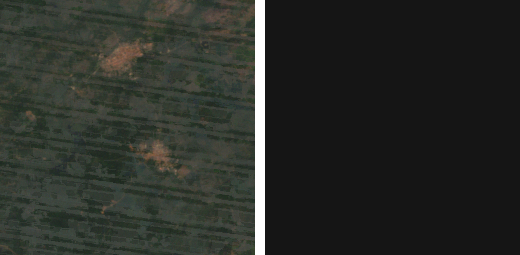
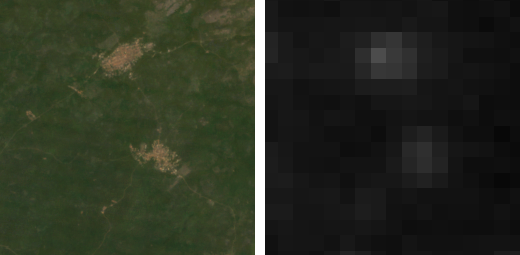
The input consists of two single 255x255x8px satellite images, taken of the same cluster at different points in time. The first 7 bands of the satellite image are surface reflectance values from the Landsat 5/7/8 satellites and have the following order: blue, green, red, shortwave infrared 1, shortwave infrared 2, thermal, and near infrared. The last band in the satellite image is the nightlights band, from either the DMSP or VIIRS satellite.
Metadata provided includes the (lat, lon) geocoordinates and country of the cluster, year of the survey, and number of observations within the cluster.
Output
The model outputs a scalar value, a prediction of the indexOfDiff label. Optionally, the model can also output a prediction for the diffOfIndex label.
Dataloader Configuration
Use the poverty_change_dataset in the SustainBench dataloader.
Download
The data can be downloaded from Google Drive here.
References
[1] United Nations Department of Economic and Social Affairs. The Sustainable Development Goals Report 2021. The Sustainable Development Goals Report. United Nations, 2021 edition, 2021. ISBN 978-92-1-005608-3. doi: 10.18356/9789210056083. URL https://www.un-ilibrary.org/content/books/9789210056083.
[2] C. Yeh, A. Perez, A. Driscoll, G. Azzari, Z. Tang, D. Lobell, S. Ermon, and M. Burke. Using publicly available satellite imagery and deep learning to understand economic well-being in Africa. Nature Communications, 11(1), 5 2020. ISSN 2041-1723. doi: 10.1038/s41467-020-58916185-w. URL https://www.nature.com/articles/s41467-020-16185-w.
[3] J. Lee, D. Grosz, B. Uzkent, S. Zeng, M. Burke, D. Lobell, and S. Ermon. Predicting Livelihood Indicators from Community-Generated Street-Level Imagery. Proceedings of the AAAI Conference on Artificial Intelligence, 35(1):268–276, 5 2021. ISSN 2374-3468. URL https://ojs.aaai.org/index.php/AAAI/article/view/16101.